How to Access FDA Adverse Event Databases: Tools, Transparency, and What You Need to Know
The U.S. Food and Drug Administration (FDA) collects over 2 million adverse event reports every year. These aren’t rumors or social media posts-they’re real reports from doctors, patients, and drug companies about harmful side effects tied to medications. This data lives in the FAERS database-the FDA’s Adverse Event Reporting System-and it’s publicly available. You don’t need a special clearance or a research grant to look at it. But if you’ve ever tried digging into it, you know: it’s not simple. There’s a gap between transparency and usability. This guide cuts through the noise. You’ll learn exactly how to access the data, what tools to use, and how to read it without being misled.
What is FAERS, and why does it matter?
FAERS stands for the FDA Adverse Event Reporting System. It’s not a clinical trial database. It doesn’t tell you how often a side effect happens in a controlled group. Instead, it’s a real-world log of reports submitted after a drug hits the market. Think of it as a giant safety net catching problems that didn’t show up during testing.
Since 1969, FAERS has collected around 30 million reports. Every year, about 75% come from drug manufacturers who are legally required to submit them. The other 25% come from healthcare providers and patients using the MedWatch program. Each report includes basic patient info (age, gender), the drug name, the adverse event (like liver damage or heart palpitations), and the outcome (hospitalized, recovered, died).
Here’s the catch: FAERS doesn’t prove a drug caused the problem. It just says someone reported it. A patient takes a new painkiller and gets dizzy. They report it. That’s one data point. Maybe the dizziness was from stress, lack of sleep, or another medication. FAERS doesn’t sort that out. That’s why experts say: “FAERS data by themselves are not an indicator of the safety profile of the drug.”
But that doesn’t mean it’s useless. It’s the best tool we have to spot hidden dangers. For example, researchers used FAERS data to find a rare interaction between a common antidepressant and a diabetes drug-something no clinical trial caught. That finding affected 1 in 10,000 patients. Without FAERS, it might have gone unnoticed for years.
How to access FAERS data: Three ways to get in
You don’t need to be a data scientist to start exploring FAERS. The FDA gives you three main paths, each suited to different needs.
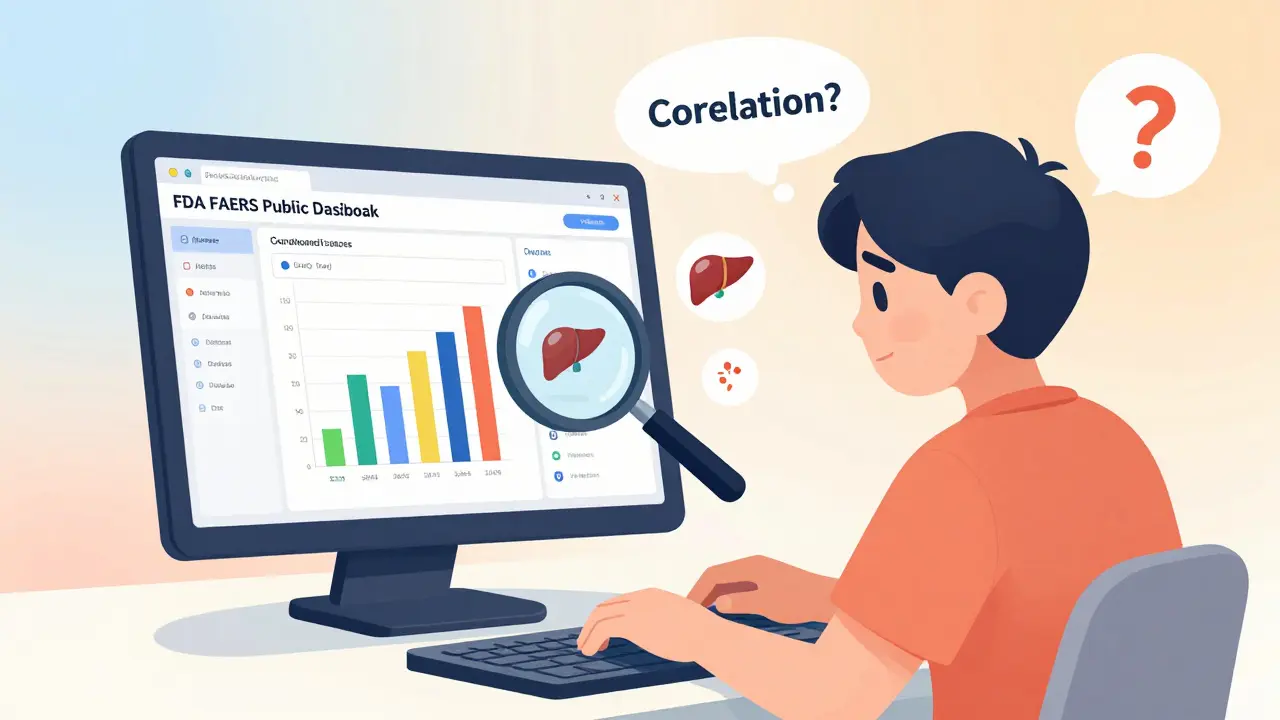
- FAERS Public Dashboard - The easiest place to start. It’s a free, web-based tool with filters for drug name, adverse event, patient age, gender, and year. You can see charts showing how many reports came in for a specific drug over time. No coding. No downloads. Just click and explore. It’s perfect for patients, patient advocates, or anyone doing a quick check.
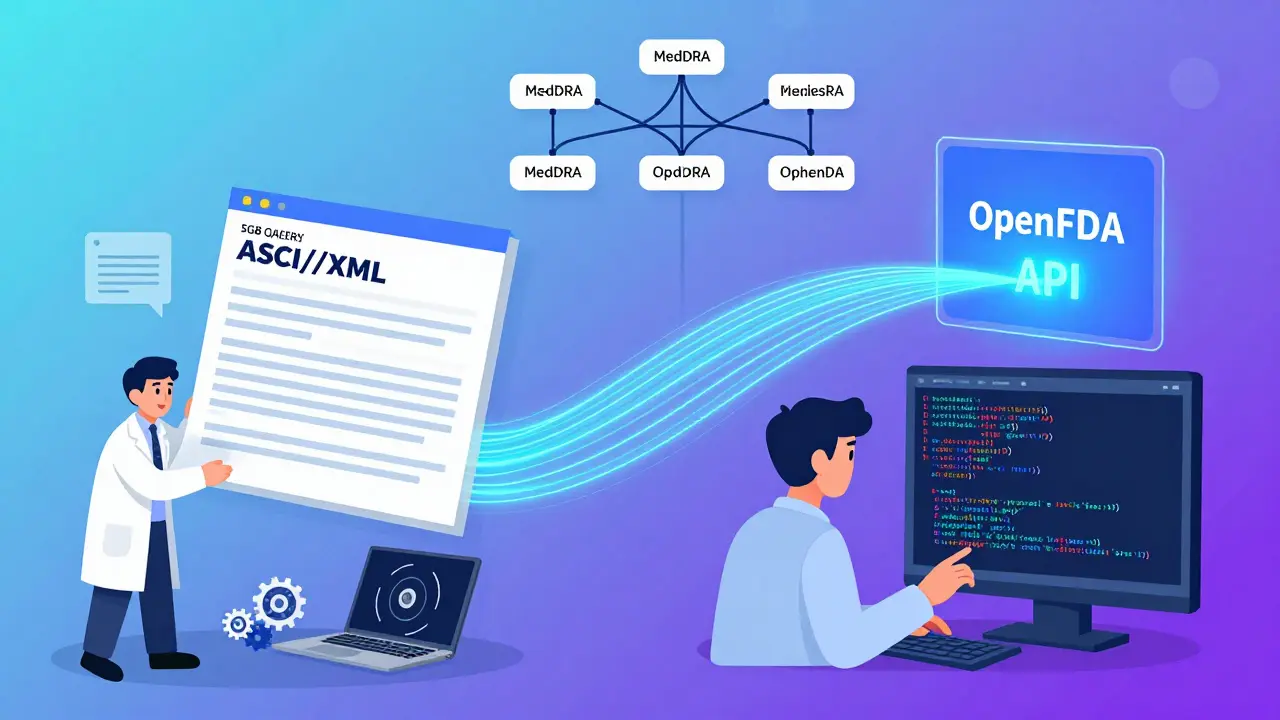
- Quarterly Data Extracts - These are raw files in ASCII or XML format. Each file is 1-5GB. You need to download them and process them with software like R, Python, or Excel. This is for researchers, students, or analysts who want to run their own queries. The FDA releases these every three months. The data includes all fields from the reports, but it’s messy. Missing values, inconsistent coding, duplicate entries-you’ll need to clean it up.
- OpenFDA API - If you know how to write code, this is the most powerful option. OpenFDA gives you JSON-formatted access to FAERS data through a simple web request. You can pull reports for a specific drug, filter by outcome, or even compare two drugs side by side. It’s faster than downloading huge files, and you can automate searches. But you need to know how to use APIs and handle JSON data.
Most people start with the Public Dashboard. If you’re doing academic research or building a tool, you’ll eventually move to the API or raw data. The dashboard is your entry point. The rest is for deeper work.
The FAERS Public Dashboard: What you can do-and what you can’t
The Public Dashboard is the FDA’s answer to making safety data accessible. Launched in 2023, it replaced older, clunkier tools. It’s clean, responsive, and designed for non-experts.
Here’s what you can do with it:
- Search for any FDA-approved drug and see how many adverse event reports were filed for it.
- Filter by adverse event using MedDRA terms (the standardized medical language the FDA uses). For example, search for “hepatotoxicity” or “arrhythmia.”
- Break down results by patient age, gender, or year to spot trends.
- Compare two drugs side by side using the “Compare Drugs” feature.
- Download charts as PNG or PDF for reports or presentations.
But here’s what you can’t do:
- Calculate how common a side effect is. FAERS doesn’t tell you how many people took the drug. So if 100 people report nausea after taking Drug X, you don’t know if that’s 1 in 100 users or 1 in 10,000.
- See individual patient names or exact addresses. All personal info is stripped to protect privacy.
- Filter by exact dosage or duration of use. The data is too inconsistent for that.
- See reports older than the last quarterly release. The dashboard updates every three months, so you’re always looking at data that’s 3-6 months old.
One user on Reddit said it best: “The dashboard makes initial exploration easy, but meaningful insights require understanding MedDRA.” MedDRA is the medical terminology system used to code adverse events. “Nausea” and “vomiting” are separate terms. “Liver injury” might be broken into 15 different subcodes. Learning these takes time-most users spend 40-60 hours just to get comfortable.
Understanding the limitations: Why FAERS data can be misleading
FAERS is powerful, but it’s not perfect. And if you treat it like a scientific study, you’ll get it wrong.
Here are the biggest problems:
- No denominator - You don’t know how many people took the drug. So a high number of reports doesn’t mean it’s dangerous-it might just mean it’s widely used.
- Reporting bias - Serious events get reported more often. A patient who has a stroke after taking a new pill is far more likely to report it than someone who gets a mild headache. Also, doctors report more than patients. And drug companies report more for drugs they’re worried about.
- Incomplete data - About 30% of reports have missing or inconsistent info. A drug name might be misspelled. A patient’s age might be blank. A side effect might be coded vaguely as “illness.”
- No causality - FAERS doesn’t say whether the drug caused the event. It just says both happened around the same time. That’s correlation, not cause.
Experts like Dr. David Graham from the FDA warn: “The database is particularly valuable for detecting rare adverse events that may not have been observed during clinical trials, but requires careful interpretation.”
That’s why you need context. If you see 500 reports of dizziness for Drug A, check how many reports exist for similar drugs. If Drug B has 400, and Drug C has 100, maybe dizziness is just common with this class of drugs-not a red flag for Drug A.
Tools and skills you need to use FAERS effectively
If you’re just curious, the Public Dashboard is enough. But if you’re doing research, you’ll need more.
For the Public Dashboard:
- No special tools needed. Just a browser.
- Spending 1-2 hours learning how filters work will get you 80% of the way.
For raw data or the API:
- Basic programming skills in Python or R are essential.
- You’ll need to install libraries like pandas (for data cleaning) and matplotlib (for charts).
- Use the OpenFDA API documentation to build queries. Example:
https://api.fda.gov/drug/event.json?search=drugname:ibuprofen+AND+reaction:headache - Have at least 16GB of RAM. A single quarterly file can be 5GB.
Training resources:
- The FDA offers free quarterly webinars with 250-300 attendees each. Recordings are posted online.
- The International Society of Pharmacovigilance has free MedDRA tutorials.
- OpenFDA has step-by-step guides for beginners on GitHub.
One researcher at Johns Hopkins said: “I spent 60 hours learning MedDRA. Now I can spot patterns others miss. It’s worth it.”
How FAERS compares to global systems
The U.S. isn’t alone in tracking drug safety. Other countries have their own systems.
Compare FAERS to:
- EudraVigilance (EU) - More detailed data, but not publicly accessible. Only qualified researchers can apply for access.
- VigiBase (WHO) - Contains reports from over 130 countries. Much larger dataset, but harder to search and less structured.
- Health Canada - Simpler interface than FAERS, but fewer filters and less frequent updates.
FAERS wins on public access. You don’t need to apply. You don’t need to wait. You can start today. That’s why 55% of U.S. pharmacovigilance research uses FAERS data.
But commercial tools like Oracle Argus Safety or ArisGlobal’s LifeSphere are better for drug companies. They integrate FAERS data with electronic health records, automate signal detection, and flag risks before the FDA does. But they cost $50,000 to $200,000 a year. FAERS is free-and that’s why academics and patient groups rely on it.
What’s next for FAERS?
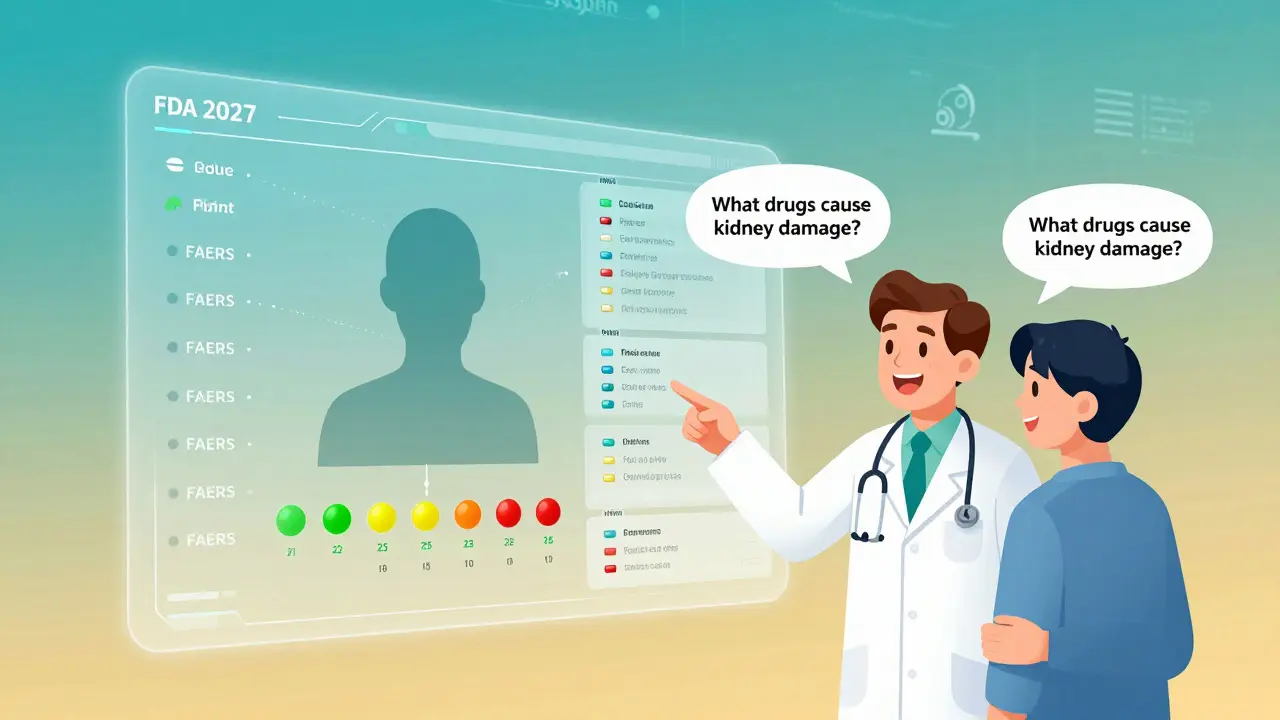
The FDA isn’t standing still. In January 2024, they switched to the ICH E2B(R3) standard, which makes reports more detailed and easier to process. By late 2024, they plan to release a new API that lets you query the dashboard’s analytics directly. In 2025, they’re adding natural language processing to make searches more intuitive-like asking, “What drugs cause kidney damage?” instead of hunting for MedDRA codes.
The big goal? Integrate FAERS with real-world data from insurance claims and electronic health records. That way, they’ll finally know how many people took a drug-and how many had side effects. That’s the missing piece. Dr. Janet Woodcock, former head of the FDA’s drug center, said: “By 2027, FAERS will be integrated with real-world data sources to provide more context for adverse event reports.”
That’s the future. But for now, FAERS remains the most transparent, most accessible drug safety database in the world. You just have to use it wisely.
Can I look up my own adverse event report in FAERS?
No. FAERS does not allow individual patients to search for their own reports. All personally identifiable information (like names, addresses, and exact dates of birth) is removed to protect privacy. If you submitted a report through MedWatch, you won’t be able to find it in the public database. The FDA reviews access requests for raw data on a case-by-case basis, but even then, only minimal information is shared.
Is FAERS data reliable for making health decisions?
Not on its own. FAERS shows associations, not causes. If you see 200 reports of chest pain linked to a new medication, it doesn’t mean the drug causes chest pain. It could be coincidence, underlying conditions, or other medications. Always talk to your doctor before changing your treatment based on FAERS data. Use it to ask better questions, not to make final decisions.
How often is FAERS data updated?
FAERS data is updated quarterly. The FDA releases new data every three months, typically about six months after the end of the reporting period. So if you’re looking at data from January to March 2025, it won’t be available until September 2025. The Public Dashboard and OpenFDA API are updated at the same time.
Do I need to pay to use FAERS data?
No. All FAERS data-whether through the Public Dashboard, OpenFDA API, or quarterly downloads-is completely free. There are no subscriptions, fees, or login requirements. This is a key difference from commercial platforms like IBM Watson Health or Oracle Argus, which charge tens of thousands of dollars per year.
Can I use FAERS data in a research paper or presentation?
Yes, and many academic papers do. But you must clearly state the limitations: FAERS data is spontaneous, unverified, and lacks denominator information. Always cite the source as “FDA FAERS database, [quarter and year].” The FDA encourages use of its data for research, education, and public health, as long as you don’t misrepresent the findings as proof of causation.
Next steps: What to do now
If you’re a patient or caregiver: Go to the FAERS Public Dashboard. Type in a drug you’re taking. See how many reports exist. Don’t panic. Just note it. Bring it up with your doctor.
If you’re a student or researcher: Download the latest quarterly data extract. Install Python and pandas. Try filtering for one drug and one adverse event. Use the OpenFDA API to automate your first search. Start small. The learning curve is steep, but it’s worth it.
If you’re in pharma or healthcare: Use FAERS as your starting point-not your endpoint. Combine it with clinical data, real-world evidence, and signal detection tools. FAERS flags potential problems. Your job is to investigate them.
Transparency means nothing without understanding. FAERS gives you the data. Now you know how to use it.
about author

Samuel Mendoza
FAERS is just a garbage pile of unverified anecdotes. If you think this data means anything, you're deluding yourself. Doctors don't even fill out half the forms properly.
Glenda Marínez Granados
So we're supposed to trust a database where someone's 'bad vibes' after taking ibuprofen counts as a 'serious adverse event'? 🤦♀️
Next they'll add 'felt sad after taking aspirin' as a coded MedDRA term.
Yuri Hyuga
This is genuinely one of the most important public health resources we have - and yet so few people understand how to use it responsibly. 🙌
Don't dismiss FAERS because it's messy - embrace it as a starting point. Learn MedDRA. Ask questions. Dig deeper. You're not just consuming data - you're helping protect lives.
MARILYN ONEILL
I read this whole thing and I'm still not sure if I should be scared of my blood pressure med or not. Honestly? I think the FDA just wants us to panic so they can sell more tests.
Coral Bosley
I took Zoloft for 3 weeks and woke up one morning feeling like my brain was being sucked out through my ears. I reported it. Nothing happened. No one called. No one cared. This whole system is a joke. They don't want to fix anything - they just want you to shut up and keep taking the pills.
Steve Hesketh
Bro. I'm from Nigeria and I just found out I can look up any drug in the FDA system for FREE? That's wild. In my country, we don't even get the basic info. This is a gift. Don't take it for granted. If you're scared of the data, that's okay - but don't run from it. Learn. Grow. Use it to ask better questions. You got this.
shubham rathee
FAERS is controlled by Big Pharma they just put in fake reports to scare people away from generics so they can charge 1000 for the brand name lol
also the dashboard updates every 6 months so they can hide the real numbers
Kevin Narvaes
i mean... if you believe in science then you believe in faers right? like... if you trust the FDA then you trust the data... unless you're one of those people who think vaccines give you alien implants? 🤔
Dee Monroe
I spent six months learning how to interpret FAERS data after my sister had a reaction to a new medication. It wasn't just about the numbers - it was about understanding silence. The reports that aren't there. The ones that got lost. The ones patients were too scared to file. The ones doctors dismissed as 'anxiety.' FAERS doesn't tell the whole story - but it whispers the truth if you're quiet enough to listen. It's not a tool for panic. It's a tool for presence. For noticing. For caring enough to dig deeper than the surface. And that? That changes everything.
Rod Wheatley
If you're using FAERS, please - PLEASE - cite the limitations. Don't just post a screenshot of a drug with 500 reports and say 'IT'S DANGEROUS.' That's not science - that's fearmongering. Use the dashboard to spark curiosity, not panic. Filter by age, compare drugs, check the time trends. And if you're doing research? Clean your data. Learn MedDRA. It's not sexy, but it's necessary. You're not just a consumer - you're a steward of public health.
lokesh prasanth
FAERS is just a marketing tool for pharma to scare patients into buying more expensive drugs
also why is everyone so obsessed with meddra its just corporate jargon
Malvina Tomja
I find it deeply concerning that the FDA allows the public to access this data without mandatory training in pharmacovigilance principles. The average user lacks the epistemological framework to interpret spontaneous reporting systems. This is not transparency - it is epistemic negligence.
MAHENDRA MEGHWAL
As someone who works in drug safety in India, I can confirm that FAERS is the gold standard for public access. Other countries have data - but not like this. Free. Open. No bureaucracy. No waiting. I wish our system was half as transparent. Thank you, FDA, for making this possible.
Sangeeta Isaac
so i searched my antidepressant and saw 12k reports of 'fatigue'... then i searched coffee and saw 8k... sooo... is coffee more dangerous than my meds? 🤷♀️
also why does everyone act like meddra is some sacred language? i just want to know if i'm gonna turn into a zombie
Alex Carletti Gouvea
This is why America is still the best. Other countries lock this data behind paywalls or bureaucracy. We give it away for free. If you can't use it, that's your problem - not ours.